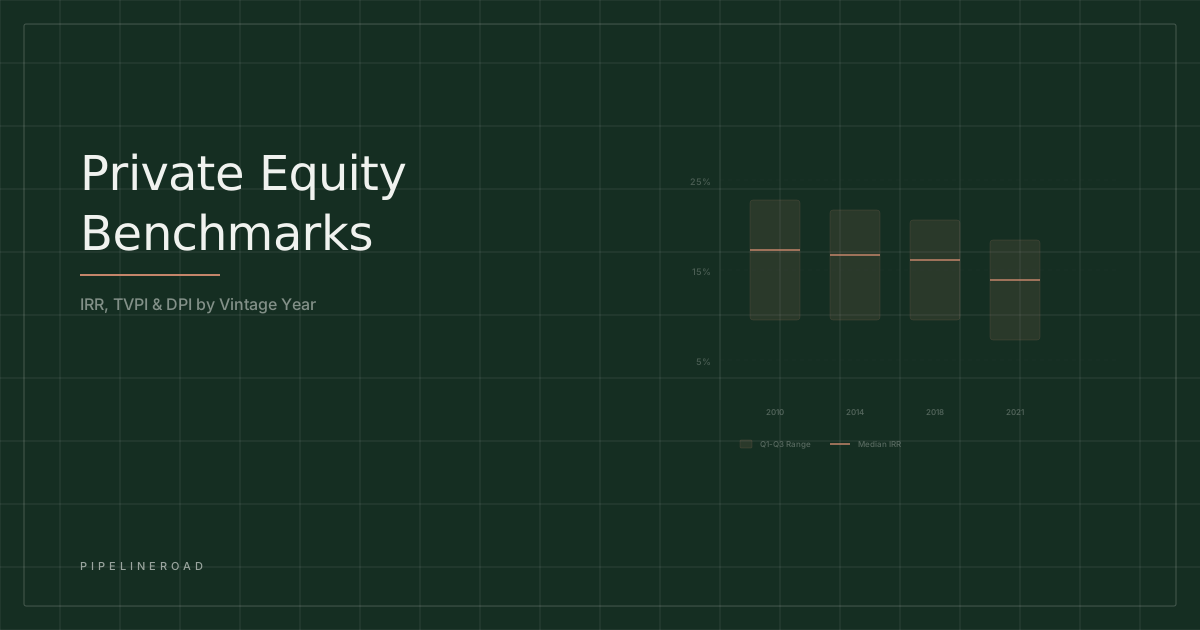
Private equity benchmarks exist to answer a deceptively simple question: is this fund’s performance good, average, or poor?
The answer requires context. A 14% net IRR means different things depending on the vintage year, strategy, fund size, and market environment. Benchmarks provide that context by aggregating performance data across hundreds or thousands of funds so that individual fund performance can be evaluated relative to peers.
Private equity benchmarks are standardized performance datasets that allow LPs to compare fund returns across vintage years, strategies, and geographies. Cambridge Associates’ US Private Equity Index returned 12.88% over 20 years, pooled and net to LPs, as of June 30, 2026 (Cambridge Associates). Quartile cutoffs are licensed benchmark data, so compare your funds with the figures from your provider. Use our fund performance benchmark tool to compare your returns against industry medians.
This guide covers the major PE benchmark providers, key metrics, how LPs actually use benchmarks in their evaluation process, and what fund managers should know about positioning their track record.
Major Benchmark Providers
Three organizations produce the most widely referenced PE benchmarks:
Cambridge Associates publishes quarterly benchmark data covering buyout, growth equity, venture capital, real estate, infrastructure, and other private markets strategies. Its Private Investments Database holds performance records for over 11,000 funds from over 2,500 managers. Cambridge uses a pooled return methodology that treats all constituent funds as a single cash flow stream, which weights larger funds more heavily. Cambridge benchmarks are widely cited in LP due diligence.
Burgiss operates the Private iQ database, sourcing performance data directly from LP portfolios. Because the data comes from LPs rather than GPs, it captures a broader universe including funds that may not report to other providers. Burgiss benchmarks tend to track closely with Cambridge but can differ in specific vintage years.
Preqin maintains a database of private capital fund records. Preqin benchmarks are based on a mix of publicly reported data and proprietary research. They cover a broader universe than Cambridge or Burgiss but may include less rigorously verified data points.
For fund managers raising capital, knowing which benchmark provider your prospective LPs use is important. Some LPs rely exclusively on Cambridge. Others use Burgiss or blend multiple sources. Comparing your fund’s performance against the wrong benchmark, or using the wrong calculation methodology, can create confusion in LP conversations.
Key Benchmark Metrics
IRR (Internal Rate of Return)
IRR is the most commonly quoted PE performance metric and the primary benchmark comparison point. Net IRR (after fees and carry) is the standard. Cambridge Associates reports both pooled IRR (the entire benchmark treated as one fund) and horizon IRR (returns over specific time periods).
Cambridge Associates’ US Private Equity Index, pooled and net to limited partners, shows the following as of June 30, 2026 (Cambridge Associates):
- 25-year pooled net IRR: 12.77%
- 10-year pooled net IRR: 15.01%
- 5-year pooled net IRR: 7.16%
The index covers US private equity across strategies rather than buyout alone. Cambridge’s Q3 2025 fact sheet notes that returns trailed public markets in recent years, with distributions recovering slowly (Cambridge Associates, Q3 2025).
TVPI (Total Value to Paid-In)
TVPI measures the total value generated per dollar of capital called, including both distributions (DPI) and remaining net asset value (RVPI). Benchmark TVPI varies by vintage year and strategy and is licensed data, so compare against your provider’s quartiles for the same vintage.
LPs use TVPI to gauge total value creation but discount the unrealized portion based on how confident they are in the GP’s marks.
DPI (Distributions to Paid-In)
DPI measures cash actually returned to LPs. In the current LP environment, DPI has become the most scrutinized metric. After years of paper gains from rising private market valuations, LPs want to see real cash. Bain reports distributions at about 14% of NAV in 2025, below 15% for four years running (Bain Global Private Equity Report 2026). Use our DPI calculator to model this metric.
Benchmark DPI varies by vintage year and strategy and is licensed data, so compare against your provider’s figures for the same vintage.
A fund that is significantly behind its vintage year DPI benchmark faces tough questions from LPs about exit execution and portfolio quality.
PME (Public Market Equivalent)
PME compares PE performance against what an LP would have earned by investing the same cash flows in a public market index. A PME above 1.0 means PE outperformed public markets. Below 1.0 means public markets would have delivered a better result.
Cambridge Associates’ modified PME (mPME) comparison shows the US Private Equity Index ahead of the MSCI World/ACWI mPME by 115 basis points over 10 years and 338 over 20 years, and ahead of the Russell 3000 mPME by 147 basis points over 20 years but behind it by 36 over 10 years, as of June 30, 2026 (Cambridge Associates). Cambridge notes that the US PE index has outperformed public markets over longer periods while trailing in recent years.
PME is increasingly important to LPs because it answers the fundamental question: is the illiquidity premium worth it? If a fund can’t beat the S&P 500 after fees and 10 years of lockup, the LP allocation case weakens significantly.
How LPs Use Benchmarks
LPs use benchmarks at two stages: initial evaluation of a new manager and ongoing monitoring of existing commitments.
Initial evaluation. When reviewing a new GP, LPs compare the GP’s prior fund performance to the relevant strategy benchmark for the same vintage year. A fund that ranks in the top quartile of its vintage year benchmark is strong. Second quartile is acceptable but not compelling. Third or fourth quartile typically disqualifies a manager from new allocations.
Ongoing monitoring. For existing commitments, LPs compare fund performance quarterly against the benchmark. A fund that starts in the first quartile but drifts to the third quartile over time raises questions about portfolio management and exit execution.
Cross-GP comparison. Sophisticated LPs don’t just compare against third-party benchmarks. They also compare GP performance across their own portfolio. If an LP has committed to 15 buyout funds in the 2018 vintage, they compare those 15 GPs against each other. Your fund’s performance relative to the other managers in the LP’s portfolio matters as much as the Cambridge benchmark.
Benchmarks by Strategy
Different strategies within private equity have different return expectations:
Buyout: The benchmark for traditional leveraged buyout funds. Quartile cutoffs by vintage are licensed data.
Growth equity: Similar structure to buyout but without leverage and with minority stakes. Growth equity benchmarks are less established because the strategy category is relatively newer.
Secondaries: Funds that buy existing LP positions, often at a discount. A faster J-curve because capital is deployed into already-maturing portfolios.
Fund of funds: Diversified exposure across multiple PE managers. Returns are compressed by an additional layer of fees.
Positioning Your Track Record
If you are raising a fund, how you present your performance relative to benchmarks matters.
Use the right benchmark. Compare against the relevant strategy and vintage year. Don’t compare a growth equity fund against the buyout benchmark to make your numbers look better. LPs will notice, and it erodes credibility.
Show gross and net. Presenting both gross and net returns demonstrates transparency. The spread between gross and net reveals your fee drag, which LPs evaluate alongside performance.
Contextualize the vintage year. A 2008 vintage fund that returned 12% net IRR is more impressive than a 2010 vintage fund that returned 15%, because the 2008 vintage faced a much harder investment environment. Vintage year context matters.
Address DPI directly. If your DPI is below the benchmark, explain why. Legitimate reasons include portfolio companies that are growing rapidly and not yet ready for exit, or a deliberate hold strategy to maximize value. Vague answers about “unrealized upside” will not satisfy experienced LPs.
For help identifying which LPs are actively re-allocating to your strategy and vintage, our LP database covers allocation mandates and recent commitment activity across thousands of institutional investors.
The Bottom Line
- Compare against the right quartile cutoffs: Cambridge’s US PE Index returned 15.01% over 10 years and 12.88% over 20 years (net to LPs, June 30, 2026), but quartile cutoffs are licensed data. A 15% net IRR in a tough vintage year (2007-2008) carries more weight with LPs than 15% in a tailwind vintage (2010-2012). Always present vintage year context.
- DPI has become the most scrutinized metric: After years of paper gains, LPs want real cash, and Bain reports distributions below 15% of NAV for four years running (Bain 2026). Funds significantly behind their vintage benchmark face tough questions about exit execution.
- PME above 1.0 is the minimum bar for justifying the illiquidity premium: Cambridge’s mPME shows the US PE Index ahead of MSCI World/ACWI over 10 and 20 years but behind over shorter horizons. Below 1.0 PME, the LP allocation case weakens.
- LPs compare you against their own portfolio, not just third-party benchmarks: If an LP has 15 buyout funds in your vintage year, your performance is ranked against those 15 GPs. Cross-GP comparison within the LP’s portfolio matters as much as the Cambridge quartile.
- Use the right benchmark for your strategy: Comparing a growth equity fund against buyout benchmarks to inflate your numbers erodes credibility. LPs notice, and it damages trust before diligence even begins.
Frequently Asked Questions
What is a good IRR for a private equity fund?
What counts as good depends on strategy and vintage year, so compare a fund's net IRR with the quartile cutoffs for its strategy and vintage from a benchmark provider; those cutoffs are licensed data. For reference, Cambridge Associates' US Private Equity Index returned 15.01% over 10 years and 12.88% over 20 years, pooled and net to LPs, as of June 30, 2026. Context matters: a 15% IRR in a challenging vintage year (2007-2008) is more impressive than 15% in a tailwind vintage (2010-2012).
What benchmarks do LPs use to evaluate PE funds?
The most widely used PE benchmarks come from Cambridge Associates, Burgiss, and Preqin. LPs typically compare fund IRR, TVPI, and DPI against the relevant strategy benchmark (buyout, growth, venture) for the same vintage year. Many LPs also calculate Public Market Equivalent (PME) to compare PE returns against what they would have earned in public equities. Increasingly, LPs compare across GPs they've invested with rather than relying solely on third-party benchmarks.
How are private equity benchmarks calculated?
PE benchmark providers aggregate performance data from thousands of funds. Cambridge Associates uses a pooled IRR methodology that treats all constituent funds as a single portfolio, weighting larger funds more heavily. Burgiss uses a similar approach with its Private iQ database. Both are net-of-fees benchmarks. It is important to compare like-for-like: buyout funds against buyout benchmarks, growth equity against growth benchmarks, and within the same vintage year.