TAM SAM SOM for SaaS: How to Calculate Market Size Without Lying to Investors
A practical guide to TAM, SAM, and SOM for SaaS companies. Real calculation methods, actual numbers, common mistakes, and how to present market sizing to investors.
Every SaaS pitch deck has a TAM slide. Most of them are wrong.
Not wrong in a rounding-error way. Wrong in a “you claimed a $50 billion market for a project management tool for dentists” way. Investors have seen thousands of these slides, and they can smell an inflated TAM from the subject line of your cold email.
The irony is that TAM, SAM, and SOM are genuinely useful frameworks when done honestly. They force you to think about who your customers actually are, how much they will pay, and how many of them you can realistically reach. The problem is that most founders treat market sizing as a persuasion exercise instead of an analytical one. They start with the number they want investors to see and reverse-engineer the math to get there.
This guide covers how to calculate TAM, SAM, and SOM for a SaaS company using real numbers and honest math. I will walk through both top-down and bottom-up approaches, show you actual examples, call out the mistakes that make investors tune out, and give you a framework for presenting market size without destroying your credibility.
I work with SaaS companies on go-to-market strategy at PipelineRoad, and I help fund managers build LP pipelines at PipelineRoad.com. I see market sizing from both sides of the table - founders pitching and investors evaluating.
TAM, SAM, SOM: What They Actually Mean
Let us start with definitions that are actually useful, not the circular nonsense you find in most business glossaries.
TAM - Total Addressable Market
Definition: The total annual revenue your product could generate if every possible customer in the world bought it and there were no competitors, no geographic limitations, and no resource constraints.
What it tells you: The ceiling. The maximum theoretical opportunity. TAM answers the question: “How big is the pond?”
What it does not tell you: Anything about reality. TAM is a theoretical construct. No company captures 100% of its TAM. Not Google, not Salesforce, not anyone.
Example: You sell expense management software for $500/month to mid-market companies (100-1,000 employees). There are approximately 200,000 mid-market companies in the US, and another 400,000 globally. TAM = 600,000 companies x $6,000/year = $3.6B.
SAM - Serviceable Addressable Market
Definition: The portion of TAM that your product can actually serve given your current capabilities, pricing, geography, and business model.
What it tells you: The realistic pond. SAM answers: “How many of these potential customers can we actually sell to?”
How it narrows TAM: SAM excludes customers who:
- Are in geographies you do not serve (yet)
- Use a competing product they are locked into (multi-year contracts)
- Need features you do not have (and will not build soon)
- Are too small or too large for your pricing model
- Operate in industries you do not support
Example: Your expense management software only supports English-language markets, requires integration with QuickBooks or NetSuite, and is priced for companies with $5M-$100M in revenue. That narrows your 600,000 global companies to roughly 80,000 companies. SAM = 80,000 x $6,000/year = $480M.
SOM - Serviceable Obtainable Market
Definition: The portion of SAM you can realistically capture in the next 3-5 years given your current team, funding, go-to-market capacity, and competitive position.
What it tells you: Your actual target. SOM answers: “Given our resources and competition, how much of this market can we win?”
How it narrows SAM: SOM accounts for:
- Competitive market share (you will not win 100% against established players)
- Your sales and marketing capacity (you can only run so many demos)
- Brand awareness and trust (you are probably not the first name buyers think of)
- Sales cycle length and conversion rates
- Churn and net revenue retention
Example: You have a 10-person sales team that can handle 200 demos/month, a 20% close rate, and 90% annual retention. Realistically, you can acquire 300-400 new customers per year. At $6,000/year per customer, your SOM is roughly $2M-$2.4M in new ARR per year, growing to $8M-$10M over 3-5 years as you scale the team.
The Two Calculation Methods (and Why You Need Both)
Method 1: Top-Down
Top-down starts with a big number and narrows it down. This is the approach that most founders default to because it produces bigger numbers.
How it works:
- Start with an industry-level number from a market research report (Gartner, IDC, Forrester, Grand View Research)
- Apply filters to narrow to your addressable segment
- Arrive at your TAM
Example - Top-Down for a CRM:
| Step | Description | Value |
|---|---|---|
| Industry size | Global CRM market (Source: Grand View Research) | $89.0B (2024) |
| Segment filter | B2B-only (excluding B2C CRM) | ~60% = $53.4B |
| Size filter | SMB and mid-market (excluding enterprise) | ~35% = $18.7B |
| Geography | North America and Europe | ~70% = $13.1B |
| TAM | $13.1B |
Strengths of top-down:
- Quick to calculate
- Uses credible third-party sources
- Good for initial back-of-envelope sizing
- Investors recognize the source reports
Weaknesses of top-down:
- Industry reports define markets differently than your product does
- Filters are subjective (why 60% B2B and not 55%?)
- Easy to manipulate by choosing favorable reports or generous filters
- Does not connect to your specific pricing and customer profile
- Investors know this and will push back
Method 2: Bottom-Up
Bottom-up starts with your specific product, pricing, and customer count. This is harder to calculate but far more credible.
How it works:
- Define your ideal customer profile (ICP) with specific attributes
- Count how many companies match that profile (using data sources like LinkedIn, ZoomInfo, Census Bureau, industry databases)
- Multiply by your annual contract value (ACV)
Example - Bottom-Up for a CRM:
| Step | Description | Value |
|---|---|---|
| ICP definition | B2B companies, 50-500 employees, tech/professional services, North America | - |
| Company count | LinkedIn Sales Navigator shows ~185,000 companies matching criteria | 185,000 |
| Addressable % | Companies using or evaluating CRM (vs. spreadsheets with no intent to change) | ~60% = 111,000 |
| ACV | Average contract: 15 seats x $50/seat/month = $9,000/year | $9,000 |
| TAM | 111,000 x $9,000 | $999M (~$1B) |
Strengths of bottom-up:
- Directly connected to your pricing and ICP
- Transparent assumptions that investors can verify
- Forces you to actually know your customer count
- Much harder to inflate without obviously faking the inputs
Weaknesses of bottom-up:
- More time-consuming
- Requires reliable data on company counts
- Can undercount if your ICP definition is too narrow
- Sensitive to ACV assumptions
Why You Need Both
The power move in an investor presentation is showing both calculations and demonstrating that they converge. If your top-down says $1.2B and your bottom-up says $1.0B, investors trust both numbers more because they were derived independently and landed in the same range.
If your top-down says $10B and your bottom-up says $500M, you have a problem. Either your top-down is inflated (most likely) or your bottom-up is too narrow (less likely). Resolve the gap before the pitch, not during it.
Real SaaS Examples with Actual Numbers
Let me walk through three real-world TAM/SAM/SOM calculations to show how this works in practice.
Example 1: HR Onboarding Software
Product: SaaS platform that automates employee onboarding workflows. Priced at $8/employee/month. Target: US mid-market companies (100-2,000 employees).
Top-Down TAM:
- Global HR technology market: $40.1B (Source: Grand View Research, 2025)
- Onboarding-specific segment: ~8% = $3.2B
- US-only: ~45% = $1.44B
Bottom-Up TAM:
- US companies with 100-2,000 employees: ~120,000 (Source: US Census Bureau, County Business Patterns)
- Average employee count in segment: 450
- ACV: 450 employees x $8/month x 12 = $43,200
- TAM: 120,000 x $43,200 = $5.18B
Gap analysis: The bottom-up ($5.18B) is significantly larger than the top-down ($1.44B). This suggests the top-down industry report defines “onboarding” more narrowly than the product actually addresses, or the product serves a broader HR workflow need. In the pitch, acknowledge this gap and explain why your bottom-up is the more relevant number.
SAM: Only companies currently using some form of HR software (not entirely paper-based) and not locked into enterprise suites like Workday or SAP. Approximately 55,000 companies. SAM = 55,000 x $43,200 = $2.38B.
SOM (3-year): With a 5-person sales team scaling to 15, targeting 800 new customers in year 1, 1,500 in year 2, and 2,500 in year 3. SOM = ~4,800 customers x $43,200 = $207M cumulative ARR by year 3.
Example 2: Vertical SaaS for Property Management
Product: All-in-one property management platform for residential property managers. Priced at $2/unit/month. Target: US property management companies with 50-5,000 units.
Bottom-Up TAM:
- US rental properties: ~48.2 million units (Source: US Census Bureau, 2024)
- Managed by professional property management companies: ~42% = 20.2M units
- ACV per unit: $2/month x 12 = $24/year
- TAM: 20.2M units x $24 = $485M
SAM: Properties in the 50-5,000 unit range managed by companies open to SaaS (excluding very small landlords using spreadsheets and very large REITs with custom systems). Approximately 12M units. SAM = 12M x $24 = $288M.
SOM (3-year): Targeting 500,000 units under management by year 3. SOM = 500,000 x $24 = $12M ARR.
Investor conversation: A $485M TAM might feel small for a VC-backed company targeting venture-scale returns. The response: show the expansion play. Property management is the wedge. Once you have the customer, you add tenant screening ($15/application), maintenance coordination ($3/unit/month), and leasing ($200/lease). The expanded ACV goes from $24/unit/year to $100+/unit/year, making the TAM $2B+. But only present the expansion TAM as a separate “where we’re going” slide, not baked into the core TAM.
Example 3: API Monitoring Platform
Product: API monitoring and observability platform for engineering teams. Usage-based pricing: $0.10 per 10,000 API calls monitored. Target: companies with 10+ engineers globally.
Bottom-Up TAM:
- Companies with 10+ engineers globally: ~350,000 (Source: LinkedIn, StackOverflow Developer Survey extrapolation)
- Average API call volume for companies this size: 50M calls/month
- Average monthly spend at $0.10/10K calls: $500/month = $6,000/year
- TAM: 350,000 x $6,000 = $2.1B
SAM: Companies actively using or evaluating API monitoring (vs. building in-house or not monitoring): ~140,000. SAM = 140,000 x $6,000 = $840M.
SOM (3-year): Targeting developer-first adoption with a freemium tier. 5,000 paying customers by year 3 at average ACV of $4,800 (usage-based tends to land below theoretical average). SOM = 5,000 x $4,800 = $24M ARR.
The Beachhead Market: Where SOM Gets Specific
SOM tells you how much market you can capture. The beachhead market tells you where to start. For how these numbers translate into actual company value, see our SaaS valuations guide. This is the concept most SaaS founders skip, and it is the one that matters most for execution.
Your beachhead is the narrowest possible segment where you can dominate. Not compete. Dominate.
Why it matters:
-
Concentration builds momentum. If you are the #1 solution for “API monitoring for fintech companies with 20-100 engineers,” you win every deal in that segment. Word-of-mouth compounds. Case studies accumulate. Your sales cycle shortens.
-
It is easier to expand from strength than from mediocrity. Salesforce started with small sales teams. Slack started with tech startups. HubSpot started with small businesses. They all expanded from beachhead dominance, not from trying to be everything for everyone on day one.
-
Investors want to see a credible SOM, not a big TAM. A $50B TAM with no clear path to your first $5M in ARR is not a pitch - it is a wish. A $2B TAM with a specific beachhead where you already have 50 customers and 90% retention is a pitch.
How to choose your beachhead:
| Factor | What to Evaluate |
|---|---|
| Problem severity | Which segment feels the most pain from the problem you solve? |
| Willingness to pay | Which segment has budget allocated for this category? |
| Accessibility | Which segment can you reach with your current go-to-market? |
| Competition | Where are incumbents weakest or absent? |
| Network effects | Which segment has the strongest word-of-mouth dynamics? |
| Expansion potential | Can you use this beachhead to move into adjacent segments? |
The beachhead should be the intersection of all six factors. If one factor is missing (high pain but no budget, or budget but unreachable), it is not the right beachhead.
Common Mistakes That Make Investors Tune Out
I have sat through hundreds of market sizing presentations. Here are the mistakes that make investors lose confidence:
Mistake 1: The “Trillion Dollar Market” Opener
“The global enterprise software market is $780 billion.” Cool. So is the market for everything from ERP systems to password managers. Starting with an absurdly large number signals that you are about to hand-wave your way to a big TAM. Start with your bottom-up calculation instead.
Mistake 2: TAM = Industry Size
Your TAM is not the size of the industry. It is the portion of the industry that could buy your specific product. If you sell marketing analytics software, your TAM is not “$600 billion global advertising market.” Your TAM is the number of companies that would buy marketing analytics software multiplied by what they would pay you.
Mistake 3: Including Customers You Cannot Serve
If your product does not work for companies under 50 employees (no budget) or over 10,000 employees (need enterprise features you do not have), do not include them in your TAM. Investors will ask “who is your customer?” and if the answer does not match the TAM slide, credibility is gone.
Mistake 4: Using Enterprise ACV When You Sell to SMB
If your average deal size is $5,000/year and your pricing page starts at $49/month, you cannot build a TAM calculation using $50,000 ACV because “some enterprise customers will pay that.” Use your actual ACV or your realistic target ACV as you scale. Investors check your pricing page.
Mistake 5: Double-Counting Through Platform Expansion
“Our CRM TAM is $2B, but we’re also building marketing automation ($1.5B TAM) and customer support ($1B TAM), so our total TAM is $4.5B.” No. Your TAM today is $2B. Your TAM tomorrow might be $4.5B if you successfully build and sell those additional products. Present the expansion opportunity as exactly that - an opportunity, not a given.
Mistake 6: Ignoring Competition in SOM
SOM should account for the fact that Salesforce, HubSpot, and ten other competitors also want those same customers. If there are 100,000 addressable companies and five strong competitors, your realistic SOM is not 100,000 companies. It is the portion you can win given competitive dynamics, switching costs, and your specific advantages.
Mistake 7: Using Stale Data
Market research reports from 2022 are ancient history in SaaS. Markets shift fast. If your TAM relies on a Gartner report from three years ago, find current data or conduct your own bottom-up analysis. Investors notice when the source date is old.
How to Present TAM SAM SOM to Investors
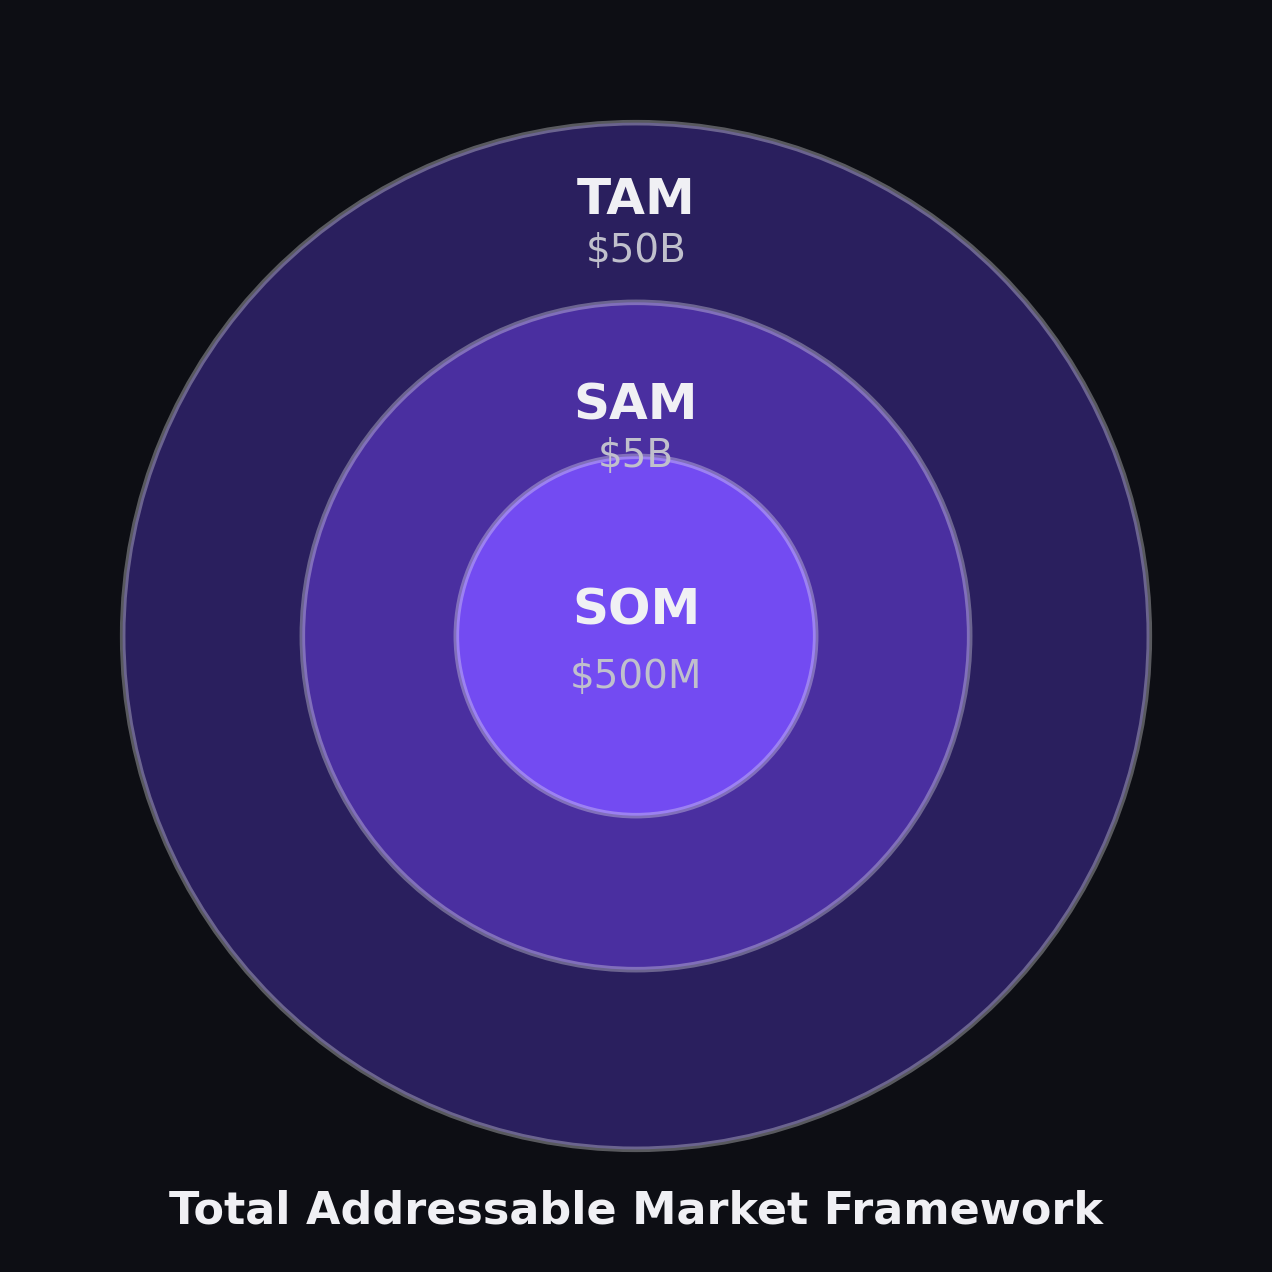
The standard concentric circle diagram is fine. Investors expect it. But the presentation matters more than the diagram.
The Presentation Framework
Slide 1: The Market (1 slide, 60 seconds)
Lead with bottom-up: “There are [X] companies matching our ICP. At our current ACV of [$Y], the bottom-up TAM is [$Z].”
Validate with top-down: “This aligns with [industry report] which sizes the [specific segment] at [$W].”
Show the concentric circles: TAM - SAM - SOM with clear labels.
For the document your investors will read before this slide, see our SaaS one-pager templates - especially the investor one-pager framework.
Slide 2: The Beachhead (1 slide, 60 seconds)
“We are starting with [specific segment] because [reasons]. There are [X] companies in this segment. We have [Y] customers today, representing [Z]% penetration.”
Slide 3: The Expansion (optional, 30 seconds)
“As we expand into [adjacent segments/products], the addressable market grows to [$X]. Here is our timeline for that expansion.”
What Investors Actually Want to Hear
-
That you know your customer. The TAM calculation should demonstrate deep knowledge of who buys your product, not abstract market sizing.
-
That you know your competitive position. SOM should reflect honest assessment of your competitive strengths and weaknesses.
-
That the math connects to your financial plan. If your SOM implies you will have 5,000 customers in 3 years, your financial plan should show the sales team, marketing budget, and infrastructure to support 5,000 customers.
-
That expansion is plausible, not promised. Investors want to see that the market gets bigger over time, but they do not want you to count on expansion revenue in your core projections.
-
That you have done original research. Using a market research report is fine for top-down validation. But investors are more impressed by a bottom-up analysis that shows you counted potential customers, validated pricing with real conversations, and built your assumptions from first principles.
TAM SAM SOM Template
Here is a practical template you can use for your own calculations:
Bottom-Up TAM Calculation
| Input | Your Value | Source |
|---|---|---|
| ICP definition | [Industry, size, geography, tech stack] | - |
| Total companies matching ICP | [Number] | [Data source] |
| % actively buying or evaluating this category | [X]% | [Research/customer interviews] |
| Addressable companies | [Number] | Calculated |
| Average seats/users per company | [Number] | [Customer data] |
| Price per seat per month | [$X] | [Pricing page] |
| ACV | [$X] | Calculated |
| Bottom-Up TAM | [$X] | Calculated |
Top-Down TAM Validation
| Input | Your Value | Source |
|---|---|---|
| Industry market size | [$X] | [Report name, year] |
| Your addressable segment (%) | [X]% | [Justify the filter] |
| Geographic filter (%) | [X]% | [Justify the filter] |
| Top-Down TAM | [$X] | Calculated |
SAM Calculation
| Filter | Companies Removed | Remaining |
|---|---|---|
| Starting addressable companies | - | [From TAM] |
| Remove: Wrong geography | [X] | [Remaining] |
| Remove: Locked into competitor (multi-year contract) | [X] | [Remaining] |
| Remove: Missing required tech stack | [X] | [Remaining] |
| Remove: Below minimum viable ACV | [X] | [Remaining] |
| SAM companies | [Final count] | |
| SAM revenue (companies x ACV) | [$X] |
SOM Calculation
| Input | Your Value | Notes |
|---|---|---|
| SAM companies | [From above] | - |
| Estimated market share capture (3-year) | [X]% | Based on competition and GTM capacity |
| SOM companies | [Calculated] | - |
| ACV (may be lower than TAM ACV for initial customers) | [$X] | Account for land-and-expand |
| SOM revenue (3-year target) | [$X] | - |
What Does Not Work: Top-Down Only Presentations
I want to be direct about this because it is the single most common problem we see in pitch decks.
If your TAM slide says “The global [industry] market is $X billion (Source: Gartner)” and then applies two percentage filters to arrive at your TAM, you have not done market sizing. You have done arithmetic on someone else’s market sizing.
Top-down only presentations fail because:
-
The industry report was not written about your product. Gartner’s definition of “CRM” includes Salesforce Enterprise ($300/user/month) and free HubSpot CRM. Those are not the same market.
-
Percentage filters are arbitrary. “We serve 35% of the CRM market” - based on what? How did you arrive at 35% and not 30% or 40%?
-
Investors cannot verify the math. They can verify company counts (LinkedIn, Census data). They can verify your pricing (your website). They cannot verify that your product addresses 35% of a Gartner market category.
-
It does not connect to your business plan. A top-down TAM of $5B does not tell you how many salespeople you need or how many demos you need to run. A bottom-up SOM of $10M ARR does.
The bottom line: start bottom-up, validate top-down, and spend the conversation on SOM and beachhead. That is where investor confidence is built.
Wrapping Up
TAM, SAM, and SOM are not vanity metrics for your pitch deck. They are strategic tools that should inform every decision you make - from pricing to hiring to market entry to product roadmap.
The companies that use market sizing well treat it as an ongoing exercise, not a one-time slide creation project. They update their TAM as they enter new markets. They refine their SAM as they learn which customer segments convert. They track SOM against actual bookings to calibrate their assumptions.
The companies that use market sizing poorly paste a big number from a Gartner report, never update it, and wonder why investors ask hard questions.
Do the bottom-up work. Be honest about your assumptions. And spend more time on SOM than TAM - because SOM is where the real business gets built.
If you need help with market sizing, go-to-market strategy, or competitive positioning for your SaaS company, PipelineRoad works with B2B SaaS companies at every stage.
Frequently Asked Questions
What is the difference between TAM SAM and SOM?
TAM (Total Addressable Market) is the total revenue opportunity if you had 100% market share with no constraints. SAM (Serviceable Addressable Market) is the portion of TAM you can actually serve given your product, geography, and business model. SOM (Serviceable Obtainable Market) is the realistic portion of SAM you can capture in the near term given competition, resources, and go-to-market capacity.
How do you calculate TAM for a SaaS company?
Two approaches: Top-down uses industry reports and market data (total industry revenue x your addressable percentage). Bottom-up counts the number of potential customers and multiplies by your annual contract value. Bottom-up is more credible for investors because it is based on your specific pricing and target customer profile, not abstract industry totals.
What is a good TAM for a SaaS startup?
Most venture investors look for a TAM of at least $1B for venture-scale returns. However, a $500M TAM with a clear path to expansion can work for seed and Series A. The TAM itself matters less than the quality of your calculation and the credibility of your assumptions. A well-defended $500M TAM is more investable than a hand-waved $10B TAM.
How do you present TAM SAM SOM to investors?
Lead with the bottom-up calculation, validate with top-down data, and focus the conversation on SOM - the market you can realistically capture in 3-5 years. Use a concentric circle diagram. Show your assumptions explicitly. Address market expansion over time. Investors respect founders who know their current market deeply rather than those who claim a massive TAM they cannot defend.
What are the most common mistakes in TAM calculation?
The five biggest mistakes: (1) Using top-down only without bottom-up validation. (2) Conflating TAM with the size of the industry rather than the addressable portion. (3) Including customer segments you cannot serve. (4) Ignoring pricing reality - using enterprise ACV when your product is SMB-priced. (5) Claiming a TAM that exceeds the total revenue of all competitors combined, which immediately flags the number as inflated.
Should TAM include adjacent markets?
Only if you have a concrete, credible plan to enter those markets. Investors see through the 'and then we expand into X' play when X is a completely different product, buyer, or go-to-market motion. Include adjacent markets as an expansion opportunity in your narrative, but do not bake them into your core TAM calculation unless you have specific product plans and a timeline.
Ready to build your SaaS marketing machine?
We have run these plays at 40+ B2B SaaS companies. Let's talk about yours.
Book a Strategy Call