SaaS Marketing Budget: Allocation Frameworks, Benchmarks, and Templates for 2026
How to build a SaaS marketing budget by stage - from seed to Series B+. Channel allocation, cost benchmarks, hire vs outsource math, and a free template.
Every SaaS marketing budget I have seen from a first-time founder follows the same pattern. They pick a round number - usually 20% of revenue, because they read that somewhere - and then allocate it based on whatever channel they used last or whatever their VP of Sales is yelling about this quarter.
That is not a budget. That is a wish list with a number at the top.
A real marketing budget is a resource allocation model. It answers three questions: How much should we spend in total? Where should we spend it? And what return should we expect? If your budget does not answer all three with data-driven precision, you are guessing. And guessing with $200K-$2M per year is an expensive habit.
This guide covers SaaS marketing budget allocation frameworks by stage, channel-by-channel cost breakdowns, the hire vs outsource decision, and the benchmark data you need to build a budget that actually maps to revenue outcomes. Kalungi has a version of this guide that focuses on their T2D3 framework. Our version focuses on what actually happens in the budgeting process at SaaS companies we work with across every stage.
The Budget as a Percentage of Revenue
Let’s start with the question everyone asks first: how much should we spend?
The honest answer is that it depends on your stage, growth rate, market, and unit economics. But here are the benchmarks that matter:
SaaS marketing spend benchmarks (2025-2026):
| Company Stage | ARR Range | Sales + Marketing as % of Revenue | Marketing’s Share | Marketing Budget (% of Revenue) |
|---|---|---|---|---|
| Pre-revenue / Seed | $0-500K | 80-120% of burn rate | 30-40% | 25-45% of burn rate |
| Series A | $500K-3M | 50-80% of revenue | 40-50% | 20-40% of revenue |
| Series B | $3M-10M | 40-60% of revenue | 40-50% | 16-30% of revenue |
| Growth | $10M-30M | 30-50% of revenue | 35-45% | 10-22% of revenue |
| Scale | $30M-100M | 25-40% of revenue | 30-40% | 8-16% of revenue |
| Mature | $100M+ | 20-35% of revenue | 30-40% | 6-14% of revenue |
Source: OpenView SaaS Benchmarks (2025), KeyBanc SaaS Survey (2025), Bessemer Cloud Index.
The critical nuance most benchmarks miss:
These percentages include everything - headcount, tools, paid media, events, content production, agency fees, and overhead. When a SaaS company says “we spend 30% of revenue on marketing,” they often mean “we spend 30% on marketing headcount and forget to include the $150K in ad spend, the $80K in tools, and the $60K in agency fees.”
Your true marketing spend is the sum of:
- Marketing team salaries and benefits
- Marketing technology stack
- Paid media spend (all channels)
- Content production (writers, designers, video)
- Events (conferences, owned events, sponsorships)
- Agency and contractor fees
- Professional development and travel
If any of those line items live outside your “marketing budget” (common with headcount or tools), your reported marketing spend is understated.
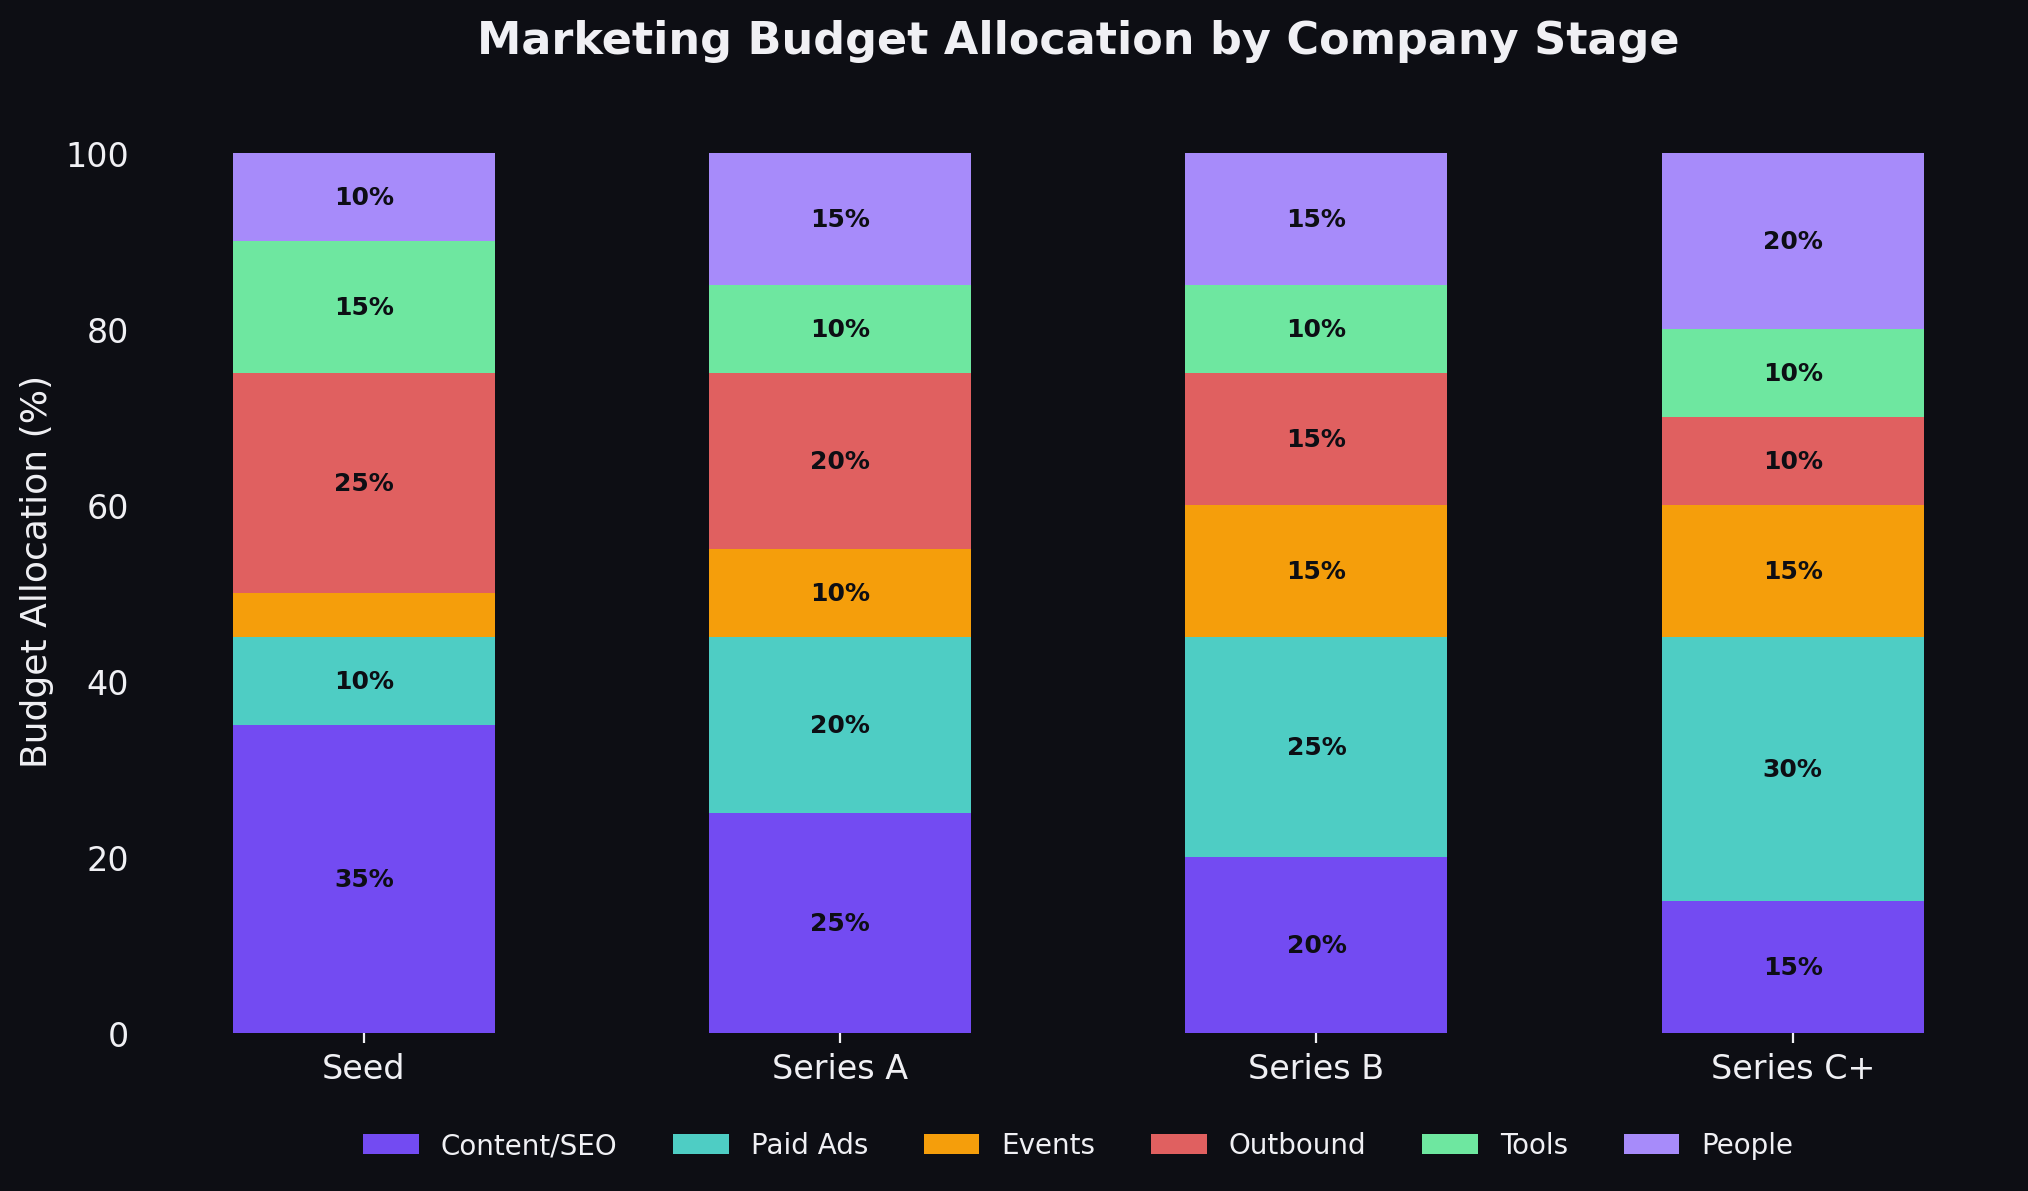
Budget Allocation by Company Stage
Stage 1: Pre-Revenue to $500K ARR (Seed)
At this stage, you do not have a marketing budget in the traditional sense. You have a burn rate, and a portion of it goes toward acquiring your first customers.
Total marketing investment: $5,000-$15,000/month (excluding founder time)
Allocation:
| Category | % of Budget | Monthly Spend | What It Covers |
|---|---|---|---|
| Outbound tools + prospecting | 30% | $1,500-4,500 | Apollo, LinkedIn Sales Nav, sending infrastructure |
| Content + SEO | 25% | $1,250-3,750 | Freelance writer, Ahrefs, basic design |
| Paid ads (LinkedIn or Google) | 20% | $1,000-3,000 | Small, targeted campaigns for demand capture |
| Website + landing pages | 10% | $500-1,500 | Webflow or basic site improvements |
| Tools + analytics | 10% | $500-1,500 | CRM (HubSpot free), GA4, email tools |
| Events + networking | 5% | $250-750 | Local events, industry meetups |
What to prioritize:
At seed stage, every dollar needs to directly generate pipeline or validate your ICP. This is not the stage for brand building, content marketing at scale, or conference sponsorships. Your priorities are:
- Founder-led outbound. The cheapest and most effective way to generate your first 10-50 customers. You are the best salesperson your company has because you understand the problem deeply.
- Basic website that converts. Not a design masterpiece. A clear value proposition, social proof (even if it is just logos), and a demo request form.
- LinkedIn organic. The founder posting 3-4x per week about the problem they are solving. Zero cost, high impact.
- Small, targeted ad campaigns. $1,000-3,000/month on LinkedIn or Google targeting your exact ICP. Test messaging and learn what resonates.
What not to do:
- Do not hire a marketing team. You cannot afford it, and you do not know enough about your market yet.
- Do not spend $10K on a conference booth. Your brand does not exist yet. Nobody will stop at your booth.
- Do not buy enterprise marketing tools. HubSpot free tier, Apollo, and Ahrefs Lite are all you need.
Stage 2: $500K-3M ARR (Series A)
You have product-market fit. You have early customers. Now the question is whether you can scale customer acquisition predictably.
Total marketing investment: $15,000-60,000/month
Allocation:
| Category | % of Budget | Monthly Spend | What It Covers |
|---|---|---|---|
| Headcount (1-2 marketers) | 30-35% | $4,500-21,000 | Marketing generalist + possibly a content or demand gen specialist |
| Paid media | 25-30% | $3,750-18,000 | LinkedIn Ads, Google Ads, potentially Meta |
| Content production | 15-20% | $2,250-12,000 | Writers, designers, SEO content |
| Tools + technology | 10% | $1,500-6,000 | HubSpot Pro, Ahrefs, analytics, ABM tools |
| Agency/contractor fees | 5-10% | $750-6,000 | SEO agency, design support, PR |
| Events | 5-10% | $750-6,000 | Industry conferences, owned dinners |
The critical decision at this stage: first marketing hire.
Your first marketing hire should be a generalist who can do three things: write (content + email), run campaigns (paid + outbound), and analyze data (attribution + reporting). This person will wear every hat for the next 6-12 months.
Do not hire a specialist first. A demand gen specialist who cannot write content, or a content marketer who cannot run paid campaigns, will leave gaps that stall growth.
Salary benchmarks for first marketing hire (2026):
| Role | Salary Range | What They Should Do |
|---|---|---|
| Marketing Manager (generalist) | $80,000-$110,000 | Everything - content, paid, email, analytics |
| Senior Marketing Manager | $100,000-$130,000 | Same, but with more experience and less hand-holding |
| Head of Marketing | $120,000-$160,000 | Strategy + execution, can build a team later |
Stage 3: $3M-10M ARR (Series B)
The marketing function matures. You are building a team, systematizing processes, and scaling multiple channels simultaneously.
Total marketing investment: $60,000-200,000/month
Allocation:
| Category | % of Budget | Monthly Spend | What It Covers |
|---|---|---|---|
| Headcount (3-6 marketers) | 35-40% | $21,000-80,000 | Head of Marketing, content, demand gen, design, possibly product marketing |
| Paid media | 20-25% | $12,000-50,000 | LinkedIn, Google, potentially programmatic |
| Content production | 15-20% | $9,000-40,000 | In-house + freelance writers, video, design |
| Tools + technology | 8-12% | $4,800-24,000 | Full marketing stack |
| Events | 8-12% | $4,800-24,000 | Major conferences, owned events, sponsorships |
| Agency/contractor fees | 5-10% | $3,000-20,000 | Specialized agencies for SEO, ABM, PR |
The team structure at this stage:
| Role | Priority | Salary Range | Focus |
|---|---|---|---|
| Head of Marketing / VP Marketing | Must have | $140,000-$200,000 | Strategy, team leadership, executive reporting |
| Content Marketing Manager | Must have | $80,000-$110,000 | Blog, SEO content, thought leadership, social |
| Demand Gen Manager | Must have | $90,000-$120,000 | Paid media, campaigns, pipeline attribution |
| Marketing Ops / RevOps | Should have | $90,000-$120,000 | CRM, automation, reporting, data quality |
| Designer | Should have | $80,000-$100,000 | Brand, ad creative, landing pages, content design |
| Product Marketing Manager | Nice to have | $100,000-$130,000 | Positioning, competitive intel, sales enablement |
Total headcount cost: $480,000-$780,000 annually.
Stage 4: $10M-30M ARR (Growth)
Marketing is a fully built function. The budget conversation shifts from “how much can we spend” to “how do we allocate efficiently.”
Total marketing investment: $150,000-500,000/month
Allocation:
| Category | % of Budget | Monthly Spend | What It Covers |
|---|---|---|---|
| Headcount (8-15 marketers) | 40-45% | $60,000-225,000 | Full marketing team across all functions |
| Paid media | 15-20% | $22,500-100,000 | Multi-channel paid programs |
| Content production | 10-15% | $15,000-75,000 | Content team + freelance + video |
| Tools + technology | 8-10% | $12,000-50,000 | Enterprise marketing stack |
| Events | 10-12% | $15,000-60,000 | Major events, customer events, field marketing |
| Agency/contractor fees | 5-8% | $7,500-40,000 | Specialized execution partners |
| Brand + creative | 3-5% | $4,500-25,000 | Brand campaigns, PR, thought leadership programs |
Stage 5: $30M+ ARR (Scale)
At this stage, the marketing budget is significant enough that allocation decisions have meaningful financial impact. CFO involvement is standard.
Key shifts at scale:
- Brand investment increases. Companies at $30M+ ARR compete for category definition, not just leads. Brand campaigns, PR, analyst relations, and thought leadership take a larger share.
- Events become a major line item. Customer conferences, field events, and industry sponsorships can consume 10-15% of the marketing budget.
- Channel diversification. No single channel should represent more than 25% of pipeline. If it does, you have concentration risk.
- Marketing ops becomes critical. The complexity of a $500K+/month marketing operation requires dedicated ops talent to manage attribution, reporting, and tech stack.
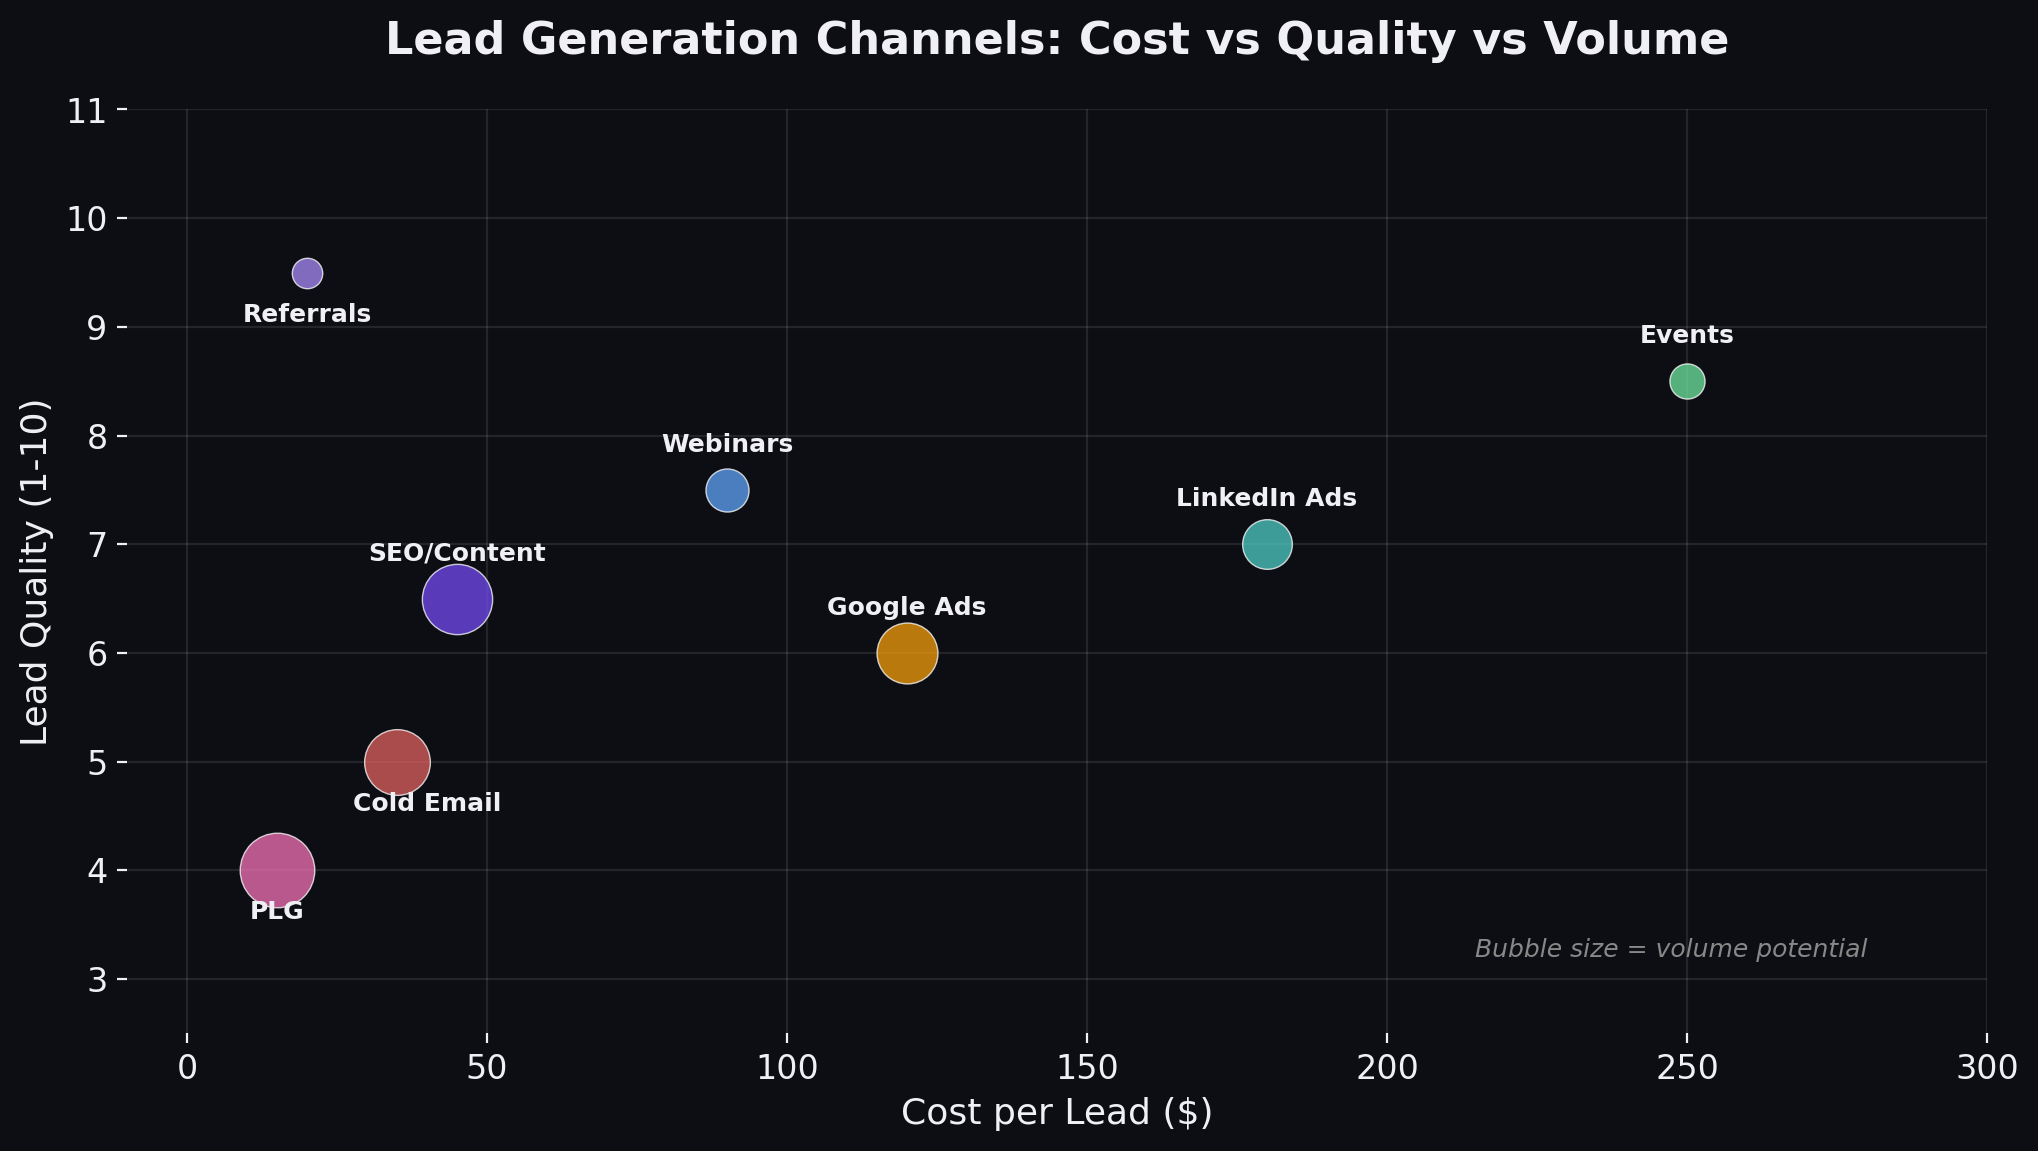
Channel-by-Channel Cost Breakdown
Here is what each marketing channel actually costs when you account for all inputs - not just ad spend or tool costs, but the people, content, and infrastructure required to make each channel work.
Content Marketing (SEO + Thought Leadership)
| Cost Component | Monthly Cost | Annual Cost |
|---|---|---|
| In-house content marketer (1 FTE) | $7,000-10,000 | $84,000-120,000 |
| Freelance writers (4-8 posts/month) | $2,000-8,000 | $24,000-96,000 |
| SEO tool (Ahrefs or SEMrush) | $100-400 | $1,200-4,800 |
| Design for content (in-house or freelance) | $1,000-3,000 | $12,000-36,000 |
| Content distribution (newsletter, social tools) | $200-500 | $2,400-6,000 |
| Total | $10,300-21,900 | $123,600-262,800 |
Expected output: 8-16 blog posts/month, 20-40 social posts/month, 2-4 lead magnets/quarter
Expected return (at maturity): 10,000-50,000 organic visits/month, 100-500 organic leads/month
Time to ROI: 6-12 months for meaningful organic traffic, 12-18 months for content to become a primary pipeline source.
Paid Media (LinkedIn + Google + Meta)
| Cost Component | Monthly Cost | Annual Cost |
|---|---|---|
| Ad spend (LinkedIn) | $5,000-50,000 | $60,000-600,000 |
| Ad spend (Google) | $3,000-30,000 | $36,000-360,000 |
| Ad spend (Meta/other) | $1,000-10,000 | $12,000-120,000 |
| Demand gen manager (1 FTE or fractional) | $5,000-10,000 | $60,000-120,000 |
| Landing page development | $500-2,000 | $6,000-24,000 |
| Creative production | $1,000-3,000 | $12,000-36,000 |
| Attribution/analytics tools | $500-2,000 | $6,000-24,000 |
| Total | $16,000-107,000 | $192,000-1,284,000 |
Expected return: Depends heavily on ACV and targeting. Benchmark: $100-300 CPL, 10-20% lead-to-opportunity rate.
Time to ROI: 60-90 days for initial optimization, 90-180 days for full campaign maturity.
Outbound (Email + LinkedIn + Sales Development)
| Cost Component | Monthly Cost | Annual Cost |
|---|---|---|
| SDR salary (1 rep) | $4,000-6,500 | $48,000-78,000 |
| SDR commission/bonus | $1,500-3,500 | $18,000-42,000 |
| Prospecting tools (Apollo, ZoomInfo, LinkedIn SN) | $300-2,500 | $3,600-30,000 |
| Sending tools (Instantly, Smartlead) | $100-500 | $1,200-6,000 |
| Copywriting (if outsourced) | $1,000-4,000 | $12,000-48,000 |
| Total (in-house) | $6,900-17,000 | $82,800-204,000 |
| Total (outsourced to agency) | $3,000-10,000 | $36,000-120,000 |
Expected return: 15-40 qualified meetings/month per SDR. At 25% opportunity conversion, that is 4-10 new opportunities/month.
Time to ROI: 30-60 days for first meetings, 90-120 days for first closed deals.
Events
| Event Type | Cost per Event | Events per Year | Annual Cost |
|---|---|---|---|
| Industry conference (booth + team) | $15,000-50,000 | 4-8 | $60,000-400,000 |
| Industry conference (speaking only) | $2,000-8,000 | 4-10 | $8,000-80,000 |
| Owned dinner/roundtable | $3,000-8,000 | 6-12 | $18,000-96,000 |
| Own customer conference | $50,000-200,000 | 1 | $50,000-200,000 |
| Virtual webinar | $500-2,000 | 12-24 | $6,000-48,000 |
| Total | $142,000-824,000 |
Expected return: Varies wildly. Owned dinners generate the highest ROI (often $200K+ pipeline per $5K event). Conference booths have the lowest ROI unless you have strong activation.
When to Hire vs When to Outsource
This is one of the most expensive decisions a SaaS marketing leader makes. Hire the wrong person and you waste 6-12 months. Outsource the wrong function and you lose strategic control. Here is the framework:
Hire In-House When:
- The function is core to your strategy. If content is your primary growth engine, hire a content team. If outbound is your main channel, hire SDRs.
- The work requires deep product knowledge. Product marketing, sales enablement, and customer marketing are hard to outsource because they require intimate understanding of your product.
- You need full-time dedication. If a function needs 40+ hours/week of attention, an agency charging monthly retainers is usually more expensive than a full-time hire.
- You have the management capacity. Every hire needs a manager. If your VP of Marketing is already managing 6 people and running campaigns, adding another direct report may not help.
Outsource to an Agency When:
- You need specialized expertise you do not have. SEO, paid media, and PR require specialized skills that take years to develop. A good agency brings that expertise on day one.
- The work is project-based or cyclical. Website redesigns, brand refreshes, and market research are better suited to agency engagements than full-time hires.
- You need to scale quickly. An agency can spin up a 5-person content team in a month. Hiring 5 people takes 4-6 months.
- You want to reduce fixed costs. Agency costs are variable. Headcount costs are fixed. In an uncertain market, the flexibility of agency spend matters.
- You need senior strategic leadership at a fraction of the cost. A fractional CMO through an agency costs $5,000-$15,000/month. A full-time CMO costs $200,000-$350,000/year plus equity.
The Hybrid Model (What Most Successful SaaS Companies Do)
| Function | In-House or Outsource | Rationale |
|---|---|---|
| Marketing strategy | In-house (or fractional CMO) | Requires deep company context |
| Product marketing | In-house | Requires deep product knowledge |
| Content strategy | In-house | Requires brand voice ownership |
| Content production | Hybrid | Strategy in-house, production outsourced |
| SEO execution | Outsource | Specialized, technical, evolves constantly |
| Paid media management | Outsource (early), in-house (scale) | Specialized at first, high-volume later |
| Outbound/SDR | Outsource (early), in-house (scale) | Agency for process development, in-house for scale |
| Design | In-house | Brand consistency requires embedded designer |
| Events | Hybrid | Strategy in-house, logistics outsourced |
| PR | Outsource | Requires media relationships and ongoing outreach |
| Marketing ops | In-house | Requires CRM and process ownership |
Cost Comparison: In-House Team vs Agency
For a Series A SaaS company ($2M ARR) that needs content marketing, SEO, paid media, and outbound:
Option A: In-House Team
| Role | Annual Cost (salary + benefits) |
|---|---|
| Head of Marketing | $150,000-$180,000 |
| Content Marketing Manager | $90,000-$110,000 |
| Demand Gen Manager | $100,000-$120,000 |
| SDR (1) | $65,000-$85,000 |
| Tools + ad spend | $120,000-$240,000 |
| Total | $525,000-$735,000 |
Time to ramp: 3-6 months for hiring, 3-6 months for team to reach full productivity.
Option B: Agency + One Internal Hire
| Component | Annual Cost |
|---|---|
| Head of Marketing (internal) | $150,000-$180,000 |
| Agency retainer (content, SEO, paid, outbound) | $120,000-$240,000 |
| Tools + ad spend | $100,000-$200,000 |
| Total | $370,000-$620,000 |
Time to ramp: 1-2 months (agency is already staffed).
For most Series A companies, Option B delivers better results faster at lower cost. The internal hire owns strategy and coordinates the agency. The agency provides the execution team.
As you scale to Series B and beyond, gradually bring functions in-house as you build management capacity and as the volume of work justifies full-time hires.
Building the Budget: Step-by-Step
Step 1: Start with the Revenue Target
Work backward from what the business needs.
Example:
- Annual revenue target: $5M ARR (up from $3M)
- New ARR needed: $2M
- Average ACV: $25,000
- New customers needed: 80
- Average win rate: 25%
- Opportunities needed: 320
- Marketing-sourced pipeline target (60% of total): 192 opportunities
Step 2: Calculate Required Pipeline
Using the opportunity target, calculate the total pipeline value needed:
- 192 opportunities at $25K ACV = $4.8M in marketing-sourced pipeline
- At 25% win rate, you need $4.8M in pipeline to close $1.2M
- Total pipeline needed (including sales-sourced): $8M
- Marketing-sourced pipeline (60%): $4.8M
Step 3: Allocate Budget by Channel
Based on your target pipeline and your channel performance data:
| Channel | Pipeline Target | Cost per Opportunity | Channel Budget |
|---|---|---|---|
| Content/SEO | $1.2M (25%) | $500 | $48,000 |
| Paid media | $1.0M (21%) | $800 | $67,200 |
| Outbound | $1.4M (29%) | $600 | $70,000 |
| Events | $0.6M (12.5%) | $1,000 | $25,000 |
| Referrals | $0.6M (12.5%) | $200 | $10,000 |
| Total | $4.8M | Blended: $576 | $220,200 |
Step 4: Add Headcount and Infrastructure
| Category | Annual Cost |
|---|---|
| Channel spend (from Step 3) | $220,200 |
| Marketing headcount (2-3 people) | $240,000-$350,000 |
| Tools and technology | $30,000-$60,000 |
| Agency fees (if applicable) | $60,000-$180,000 |
| Contingency (10%) | $55,000-$81,000 |
| Total marketing budget | $605,200-$891,200 |
As a percentage of $5M ARR target: 12-18%.
Step 5: Build the Monthly Cash Flow
Spread the annual budget across months, accounting for:
- Front-loading: Spend more in Q1-Q2 to build pipeline for Q3-Q4 closings
- Event timing: Conference budgets cluster around major industry events
- Hiring timeline: New hires ramp over 3 months, so budget their full impact starting month 4
- Seasonal patterns: B2B SaaS typically sees lower activity in December and August
What Doesn’t Work: Budget Mistakes That Waste Money
Spreading budget too thin across too many channels. If you have $10K/month in ad spend, do not split it across LinkedIn, Google, Meta, and programmatic. You will be below the effective threshold on all four. Pick one or two channels and fund them properly.
Budgeting for tools you will not fully implement. The average SaaS marketing team uses 40% of its tool capabilities (Source: Gartner MarTech Survey, 2025). Before buying a new tool, audit your current stack. You probably have features you are paying for and not using.
Not budgeting for content distribution. Most companies budget for content creation but nothing for distribution. A $2,000 blog post that nobody reads is a $2,000 waste. Budget for paid amplification, email promotion, and social distribution of every piece of content.
Cutting marketing budget during a downturn. This is the most common and most destructive budget mistake. When revenue is down, the instinct is to cut marketing first. But marketing investments compound. Cutting SEO, content, and brand in a downturn means you emerge from the downturn with less pipeline, less brand awareness, and less organic traffic. Your competitors who maintained their marketing investment are now ahead.
Budgeting based on last year plus 10%. Incremental budgeting is lazy budgeting. Every year, build the budget from scratch based on current revenue targets, current channel performance, and current market conditions. A zero-based approach takes more work but prevents legacy spending on channels that no longer perform.
Forgetting to budget for the unexpected. Every marketing plan has surprises - a competitor launches a campaign you need to respond to, a PR crisis requires immediate spend, a new channel opportunity emerges mid-year. Build a 10-15% contingency into every budget.
Measuring budget efficiency by CPL instead of CAC. A channel with a $50 CPL and 2% close rate costs you $2,500 per customer. A channel with a $200 CPL and 25% close rate costs you $800 per customer. The “expensive” channel is 3x more efficient. Always measure full-funnel economics, not top-of-funnel costs.
Budget Reallocation Triggers
Your initial budget allocation is a hypothesis. Review and reallocate quarterly based on these signals:
| Signal | Action |
|---|---|
| A channel’s cost per opportunity rises more than 30% over two quarters | Reduce allocation, investigate root cause |
| A channel’s pipeline contribution exceeds its budget share by 2x+ | Increase allocation (it is underinvested) |
| Win rate from a specific channel drops below 15% | Investigate lead quality, potentially reduce allocation |
| A new channel test shows promising early results | Fund with 5-10% reallocation from lowest-performing channel |
| CAC payback exceeds 24 months | Reduce total spend or shift to lower-cost channels |
| Competitor enters your paid media keywords aggressively | Shift some paid budget to content/brand (reduce bidding war exposure) |
The Budget Template
Here is a simplified budget template structure you can adapt for your SaaS company:
Annual Budget Summary
| Category | Q1 | Q2 | Q3 | Q4 | Annual |
|---|---|---|---|---|---|
| Headcount | |||||
| Marketing leadership | |||||
| Content team | |||||
| Demand gen team | |||||
| Design | |||||
| Marketing ops | |||||
| Paid Media | |||||
| LinkedIn Ads | |||||
| Google Ads | |||||
| Other paid channels | |||||
| Content Production | |||||
| Freelance writers | |||||
| Video production | |||||
| Design assets | |||||
| Tools + Technology | |||||
| CRM / marketing automation | |||||
| SEO tools | |||||
| Analytics / attribution | |||||
| Sales engagement | |||||
| Events | |||||
| Conference sponsorships | |||||
| Owned events | |||||
| Virtual events | |||||
| Agency / Contractors | |||||
| SEO agency | |||||
| PR agency | |||||
| Outbound agency | |||||
| Contingency (10-15%) | |||||
| TOTAL |
Monthly Tracking
Track actual spend against budget monthly. Identify variances early. A 5% overspend in January is manageable. A 5% overspend every month for six months is a 30% budget overrun.
Key metrics to track alongside budget:
- Spend vs budget (by category and channel)
- Pipeline generated vs target (by channel)
- Cost per opportunity (by channel, trended quarterly)
- CAC payback period (blended and by channel)
- Marketing efficiency ratio (pipeline generated / marketing spend)
Budget Benchmarks by Vertical
Marketing budget allocation varies by SaaS vertical. Here are benchmarks for common B2B SaaS categories:
| SaaS Vertical | Avg Marketing Budget (% of Revenue) | Top Channel | Paid Media Share | Content Share |
|---|---|---|---|---|
| DevTools / Developer-focused | 10-20% | Content/SEO + community | 10-15% | 30-40% |
| Sales / CRM | 20-35% | Paid + outbound | 25-35% | 15-25% |
| HR Tech | 20-30% | Paid + content | 25-30% | 20-30% |
| FinTech | 15-25% | Events + content + paid | 20-25% | 20-25% |
| MarTech | 25-40% | Content + paid + partnerships | 20-30% | 25-35% |
| Cybersecurity | 15-25% | Events + ABM + content | 15-20% | 20-30% |
| Vertical SaaS | 15-25% | Events + outbound + community | 15-20% | 15-25% |
Source: KeyBanc SaaS Survey (2025), OpenView SaaS Benchmarks (2025).
The Bottom Line
Your SaaS marketing budget is not a spreadsheet exercise. It is a strategic document that translates revenue targets into resource allocation decisions.
Start with revenue. Work backward to pipeline. Allocate budget across channels based on data, not instinct. Build in flexibility with a contingency buffer and quarterly reallocation triggers. And track full-funnel economics, not vanity metrics.
The companies that grow efficiently are not the ones that spend the most on marketing. They are the ones that allocate intelligently, measure rigorously, and reallocate ruthlessly when the data says a channel is underperforming.
Whether you are a seed-stage founder building your first budget on a $5K/month shoestring or a VP of Marketing at a Series B company allocating $200K/month across 8 channels, the principles are the same: every dollar should trace a line from spend to pipeline to revenue. If it cannot, it should not be in the budget. For help building a SaaS demand generation engine that maps to these budget frameworks, see our complete playbook.
Benchmark data in this guide is sourced from OpenView SaaS Benchmarks (2025), KeyBanc SaaS Survey (2025), Bessemer Cloud Index, Gartner MarTech Survey (2025), and aggregate budget data from B2B SaaS marketing programs managed by PipelineRoad. Updated March 2026.
PipelineRoad builds and manages marketing programs for B2B SaaS companies - from budget planning and channel strategy through execution and pipeline measurement. If you need a marketing engine without building a 10-person team, let’s talk.
Frequently Asked Questions
How much should a SaaS company spend on marketing?
The standard benchmark is 15-50% of revenue, depending on your growth stage and targets. Seed and Series A companies typically spend 30-50% of revenue on sales and marketing combined, with marketing taking 40-60% of that. Series B companies spend 25-35%. Growth-stage companies at $20M+ ARR typically spend 15-25%. The right number depends on your growth rate targets, market competition, and unit economics. If your CAC payback is under 18 months and you are growing faster than competitors, you are probably spending the right amount.
What percentage of a SaaS marketing budget should go to paid ads?
Paid advertising (LinkedIn, Google, Meta) should represent 20-35% of your total marketing budget at most stages. Early-stage companies often allocate more (30-40%) because paid generates pipeline faster than organic channels. As your content and SEO compound, shift paid allocation down to 15-25% and reinvest in content, events, and brand. Never let paid exceed 50% of your marketing budget - if you do, your pipeline disappears the moment you cut ad spend.
When should a SaaS company hire a marketer vs use an agency?
Hire when you need someone dedicated full-time to your company, deeply embedded in your product and culture. Use an agency when you need specialized execution (SEO, paid media, content production) without the overhead of a full-time hire, or when you need senior strategic leadership (fractional CMO) that you cannot afford at full-time rates. Most SaaS companies under $5M ARR get the best ROI from a combination: one internal marketing generalist who owns strategy and coordination, plus an agency for execution.
What is the average CAC for B2B SaaS?
Average CAC for B2B SaaS varies widely by ACV and go-to-market model. For SaaS with ACV under $5K, average CAC is $500-$2,000. For $5K-25K ACV, CAC ranges from $2,000-$10,000. For $25K-100K ACV, CAC is typically $10,000-$40,000. For enterprise deals above $100K ACV, CAC can exceed $50,000. The more important metric is CAC payback period - healthy SaaS companies recover their CAC within 12-18 months.
How do you build a SaaS marketing budget from scratch?
Start with your revenue target and work backward. Define your annual revenue goal, calculate the number of new customers needed (revenue target divided by ACV), estimate the marketing-sourced pipeline required (using your win rate), and then allocate budget across channels based on your cost per opportunity benchmarks. Add headcount costs, tool costs, and a 10-15% contingency. The total should land between 20-40% of revenue for most growth-stage SaaS companies.
What SaaS marketing budget categories should I include?
The standard budget categories are: headcount (salaries, benefits, contractors), paid media (LinkedIn, Google, Meta, programmatic), content production (writing, design, video), tools and technology (CRM, SEO tools, analytics), events (conferences, owned events, sponsorships), and agency/contractor fees. Many teams forget to budget for professional development, team travel, and contingency - include a 10-15% buffer for unplanned opportunities.
Ready to build your SaaS marketing machine?
We have run these plays at 40+ B2B SaaS companies. Let's talk about yours.
Book a Strategy Call